
D-fenceline™
The world's most versatile, sensitive, and cost-effective real-time fenceline air monitoring system. Tailored sensor configurations detect and quantify 200+ compounds in real time across your entire facility boundary.
Real-Time Data. Actionable Intelligence.
Our cloud-based dashboard transforms complex monitoring data into clear, actionable intelligence. Monitor compound concentrations, track source locations, and generate compliance reports — all from a single interface.
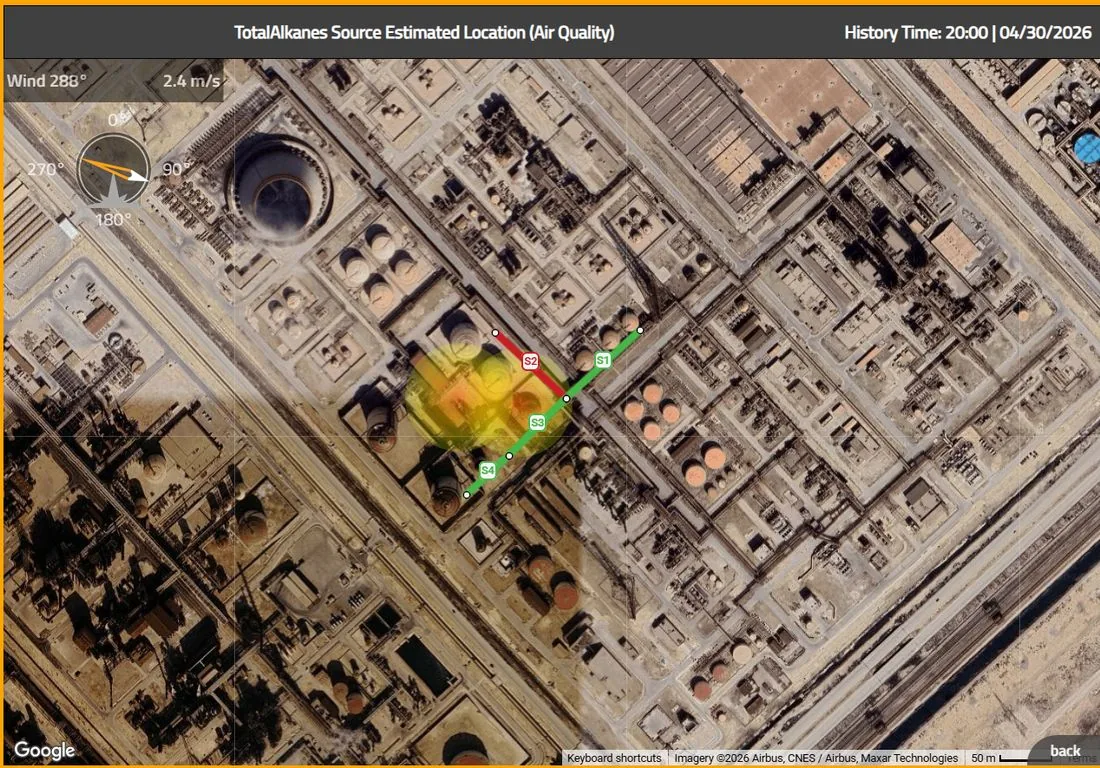
Deploy. Detect. Locate.
Deploy
Sensor configurations tailored to your facility's needs, backed by a detailed monitoring plan that accounts for compound lists, detection limits (MDL and UDL), interferences, topography, meteorology, regulatory requirements, and budget. Support spans infrastructure design through day-to-day operation.
Detect
Continuous, simultaneous scanning across a long list of 200+ target compounds, with sub-parts-per-billion (ppb) sensitivity.
Detects a wide range of compounds, including VOCs such as BTEX, ethylene oxide, amines, and mercaptans; greenhouse gases (GHGs); inorganic acids (HF, HCl); PAHs; and more.
Our patented analysis algorithms enable unmatched detection limits and validate measurements with real-time QA/QC — so you can trust the results.
Locate
Proprietary source-location technology combines multi-point measurements with meteorological data to triangulate emission origins directly on your facility map in near real time.
This enables faster root cause analysis (RCA), supports automation of investigation workflows, and lets you isolate and subtract external contributing sources.
See the Source, Not Just the Signals
When? What? Where? How much?
Traditional monitoring tells you what was in the air. D-fenceline tells you when it happened, where it came from, and how significant the event was.
With automated source localization, event quantification, and advanced background subtraction, the platform delivers accurate emissions intelligence — even in complex industrial environments with multiple neighboring emitters.
Real-time detection and alerting. High time-resolution monitoring and effective plume capture identify emissions within minutes of release — instead of weeks or months after the event begins.
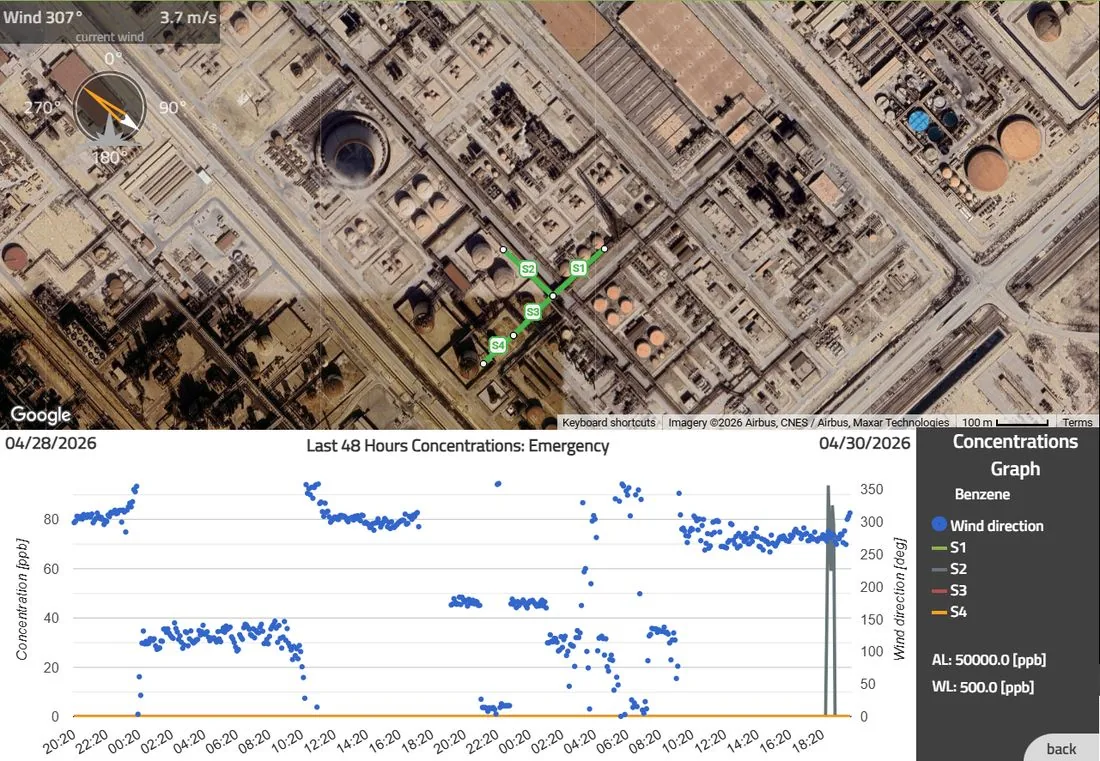
Simultaneous detection and identification of dozens of compounds with confident speciation. Real-time spectral validation and proprietary analysis algorithms eliminate ambiguity, providing high-confidence identification of measured emissions.
The chemical composition of each emission event helps identify both the emission source and the industrial process involved — enabling faster investigation, root-cause analysis, and corrective action.
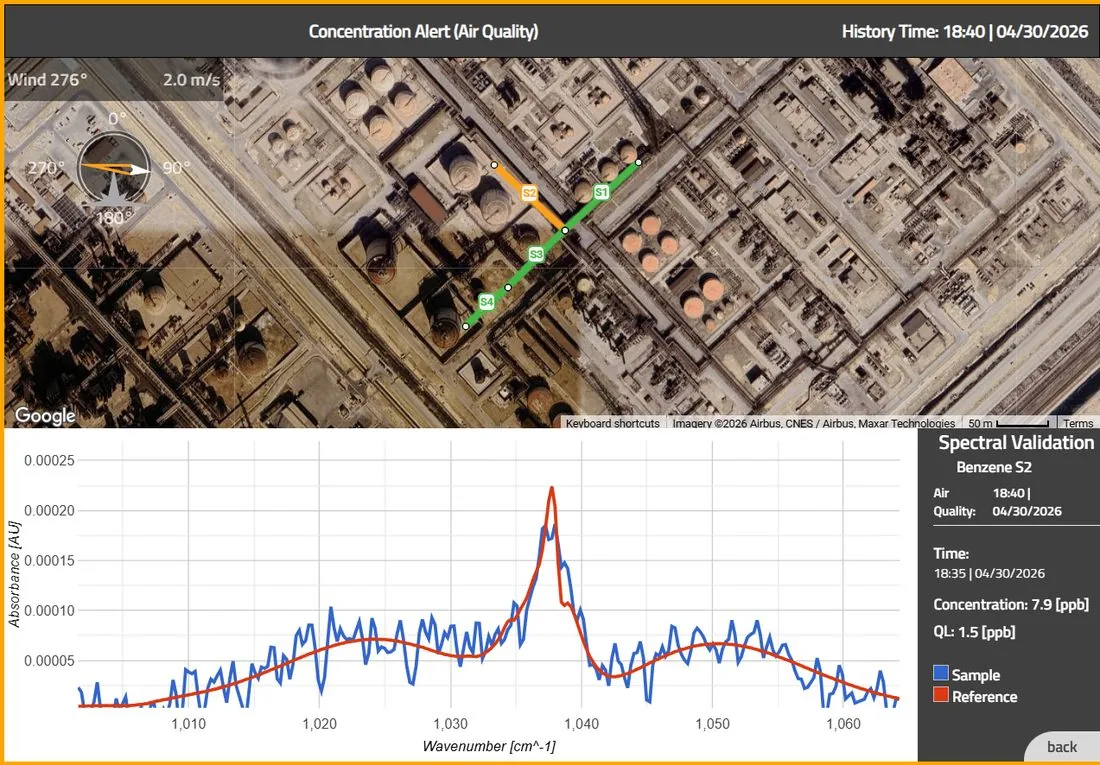
Continuous multi-point and open-path monitoring, combined with real-time meteorological data, enables accurate triangulation of emission origins directly on your facility map.
The platform also distinguishes on-site emissions from upwind and off-facility contributors — supporting defensible analysis and affirmative evidence for external emission sources.
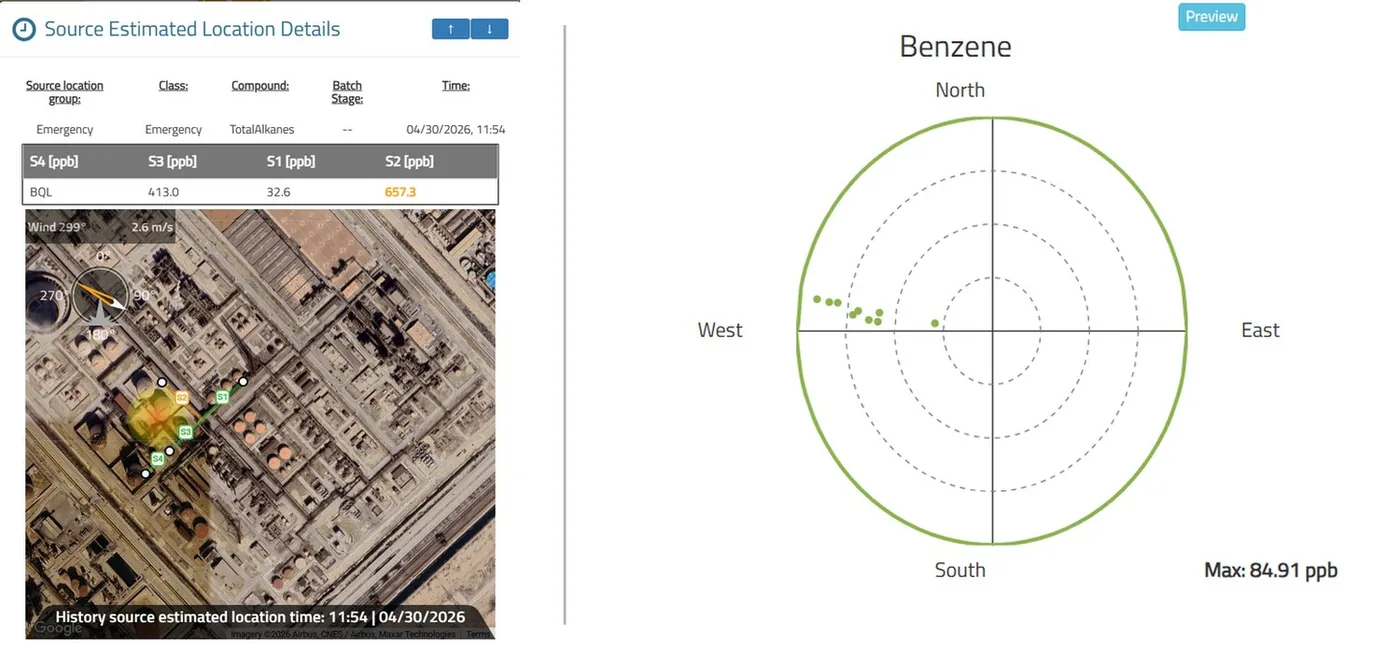
Concentration alone can misrepresent the true scale of an emission event. D-fenceline combines multi-path measurements with real-time meteorological data to quantify the actual magnitude of emissions.
Patented algorithms calculate emission flux rates for short-duration events and aggregate them into annualized emission estimates aligned with EPA methodologies and guidance — delivering actionable and defensible emissions intelligence.



All Six Target Compounds. Below Required MDLs.
The D-fenceline system provides comprehensive monitoring capability for all six HON target compounds, consistently achieving detection limits well below EPA requirements.
MDL: 0.050 ppb (GC) / 0.850 ppb (FTIR)
MDL: 0.050 ppb (GC) / 0.250 ppb (FTIR)
MDL: 0.015 ppb (GC) / 0.400 ppb (FTIR)
MDL: 0.070 ppb (GC) / 0.300 ppb (FTIR)
MDL: 0.040 ppb (GC) / 0.300 ppb (FTIR)
MDL: 0.050 ppb (GC)
Additional Sample MDLs
A sample of typical detection limits achievable with D-fenceline across our 200+ compound capability. Not seeing your target compound? Contact us for specific detection limits at your facility.
Measurement sensitivities (MDL) are specified for Open Path FTIR with a 60-minute averaging time. Final detection sensitivity depends on site-specific conditions, including meteorology, visibility, atmospheric conditions, and overall system quality. Where lower detection limits are required, MDLs can be improved further or achieved by integrating additional monitoring technologies.