
SatLeak™
Satellite-based detection and quantification of methane super-emitters across oil & gas operations, landfills, wastewater treatment plants, and coal mines — aligned with OGMP 2.0 to enhance LDAR, improve safety, reduce emissions, and ensure regulatory compliance.
Methane Leaks You Can't See — Until Now
The energy sector accounts for around 40% of human-caused methane emissions — yet traditional ground-based LDAR programs are limited by access, cost, and frequency.
SatLeak changes that equation. Using hyperspectral and multispectral satellite imagery analyzed by Momentick's proprietary algorithms, enhanced with Atmosfir reporting and QA/QC, SatLeak detects and quantifies methane super-emissions from space — covering areas that would take ground crews weeks to survey.
facilities found leaking methane in satellite monitoring campaigns
of satellite imagery analyzed for methane in 2024
CO₂-equivalent emissions detected by satellite in 2024
of detected emissions came from just 10% of assets — the super-emitter problem
Software-Defined Emissions Monitoring
Unlike systems that require dedicated satellites, SatLeak applies advanced proprietary algorithms to imagery from multiple third-party satellite sources — enabling broader coverage at lower cost.
Set Your Area of Interest
Our experts design a fit-for-purpose satellite monitoring program. Enter coordinates for any facility, pipeline, or region. Monitor single assets or entire production basins.
Autonomous Analysis
Proven proprietary algorithms analyze satellite imagery pixel by pixel, detecting elevated methane concentrations and tracing them to the source — with flux detection limits of <50 kg/hour onshore and >500 kg/hour offshore.
Prioritized Intelligence
Receive emission alerts, quantified leak rates, and historical trend data. Prioritize repairs by volume and deploy crews where they matter most.
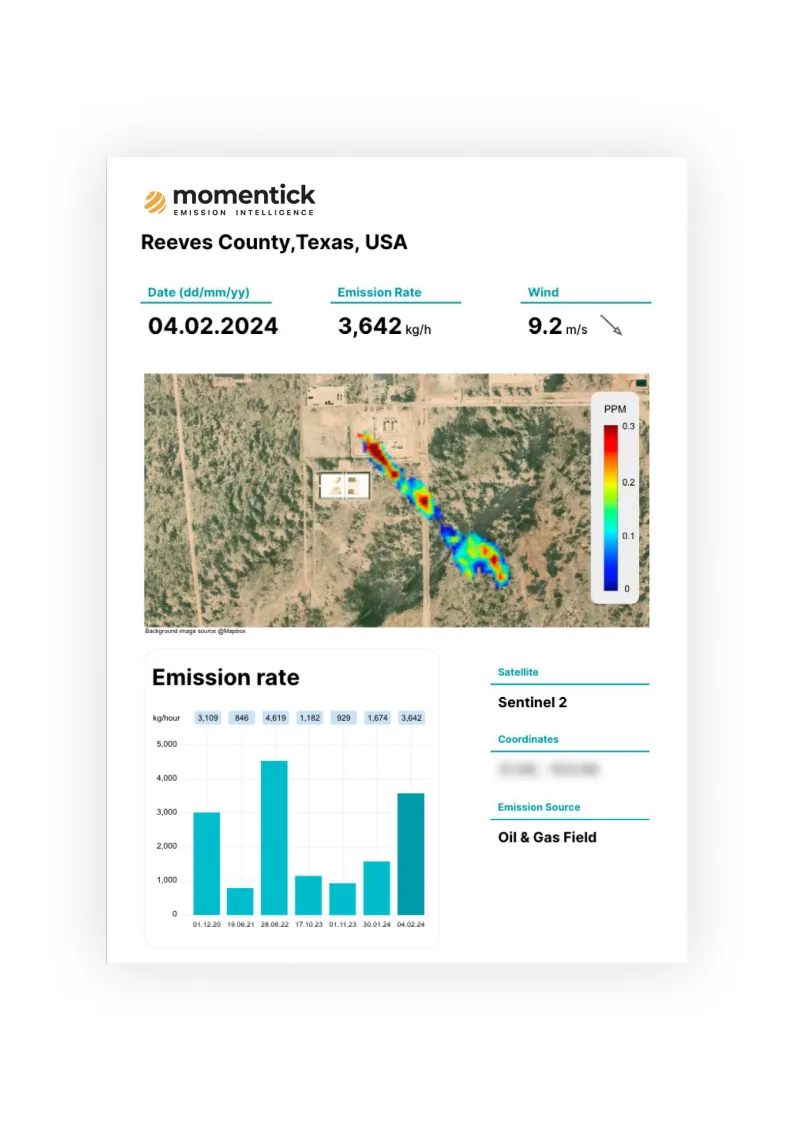
A Complementary Layer for Methane Monitoring
SatLeak is built to fill the gaps in existing LDAR programs, not replace them — providing frequent revisit, wide-area surveillance, and historical context that ground crews and aerial surveys can't deliver on their own.
Beyond Single-Constellation Coverage
Most satellite methane services are tied to a single proprietary constellation. SatLeak applies its detection algorithms to a wide range of commercial and non-commercial satellite sources — broader coverage, more frequent revisits, no vendor lock-in.
A Wide-Area Layer for Ground LDAR
Ground LDAR (Method 21, OGI surveys) is essential for component-level repair but limited by access, labor, flux estimation, survey frequency, and a horizontal line of sight that depends on wind direction. SatLeak provides frequent, vertical, top-down surveillance from space that flags major emission events between scheduled LDAR surveys — pointing crews exactly where to look.
Persistent Archive vs. Point-in-Time Surveys
Aerial flyovers and drone surveys deliver high-resolution snapshots — but only of the moment they were flown. SatLeak builds a frequent record of every monitored asset, enabling baseline comparison, trend analysis, and reach-back investigation.
Three Ways to Engage
Whether you need a one-time wide-area baseline assessment, an ongoing monitoring program, or historical satellite analysis, SatLeak engagements are tailored to match the environmental questions you need answered.
Validate Before You Scale
A short-term, defined-scope deployment to test SatLeak against your known assets. Validate detection performance, integrate results with internal workflows, and build the business case for broader rollout.
Ongoing Monitoring at a Defined Cadence
Recurring monitoring at the frequency you choose — weekly, monthly, or quarterly. Automated reports flag new emissions, super-emitter events, and deviations from baseline, feeding directly into your existing LDAR program.
Reach Back Into the Record
Reach-back analysis using archived satellite imagery to reconstruct the emissions record of a site over months or years — supporting incident investigations, regulatory inquiries, compliance audits, M&A due diligence, litigation, and verification of previously reported emissions data.
Oil & Gas Offshore Rig Case Study
A large-scale monitoring campaign covering more than 70 offshore oil and gas sites identified significant methane emissions exceeding 500 kg/hour at approximately 20% of the surveyed sites. Total estimated emissions reached nearly 40,000 kg/hour — representing a potential economic loss valued at tens of millions of dollars annually.
Rapid detection and quantification enabled operators to prioritize mitigation efforts based on emission severity and operational impact, leading to substantial emission reductions and significant annual cost savings.
Beyond the financial impact, the project improved operational safety, reduced environmental pollution, and lowered the risk of regulatory non-compliance, including potential fines, legal exposure, and reputational damage.
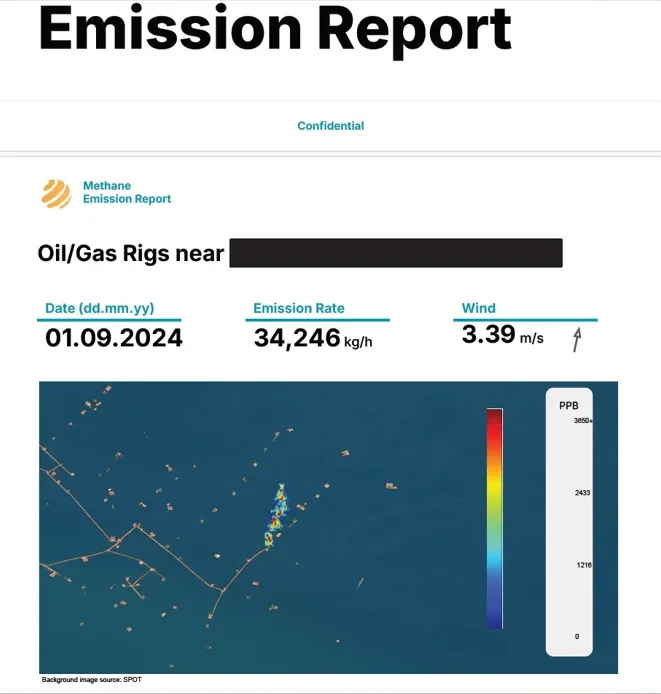
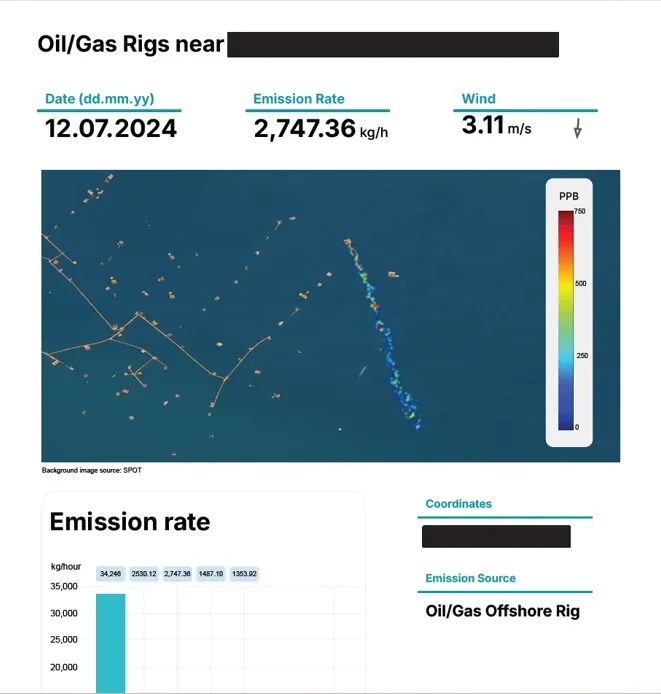
Momentick Emission Report data. Satellite: Sentinel-2. Location bars redacted per partner agreement.
Estimate the Cost of a Methane Leak
Methane loss is gas value walking off-site. Enter a leak rate and current gas value to see the estimated cost per hour, day, month, and year.
- Estimates product-value loss only — excludes carbon price, fines, safety risk, reputational impact, downtime, and mitigation costs.
- Fuel and gas prices change daily — verify before using results.
- Default gas value reflects Henry Hub (NYMEX) Spot or Near-Month pricing in the U.S., approximately $2.75 USD/MMBtu.
- Outside the U.S., gas prices may be significantly higher — often 5–10× — based on markets like Dutch TTF (Europe).
Where SatLeak Delivers Value
- Super-emitter identification across wide areas or pipeline corridors with multiple potential emitters
- Pre-acquisition due diligence on oil & gas assets
- Pipeline corridor surveillance, including remote segments
- Offshore platform monitoring where ground LDAR is impractical
- Landfill methane measurement and gas-recovery project verification
- Regulatory filings, EPA methane rule compliance, and OGMP 2.0 reporting
- Independent verification of self-reported emissions inventories
From Satellite to Fenceline
SatLeak identifies leaks from space. D-fenceline™ pinpoints them at the facility boundary. Together, they provide the most comprehensive emissions monitoring capability available.